Step 3: Cloud Setup

Deployment Option 1 - Manual
kuksa.cloud - Eclipse Hono (Cloud Entry)


Eclipse Hono provides remote service interfaces for connecting large numbers of IoT devices to a back end and interacting with them in a uniform way regardless of the device communication protocol.
Bosch IoT Hub as Hono

The Bosch IoT Hub comprises open source components developed in the Eclipse IoT ecosystem and other communities, and uses Eclipse Hono as its foundation. Utilizing Hono is essential to deal with a large amount of connected vehicles due to its scalability, security and reliability. The Bosch IoT Hub is available as a free plan for evaluation purposes. The following steps describe how to create a free Bosch IoT Hub instance.
- If you don’t have a Bosch ID, register one here and activate your ID through the registered E-Mail.
- Go to the main page and click “Sign-in” and finish signing-up for a Bosch IoT Suite account. Then you would be directed to the “Service Subscriptions” page.
- In the “Service Subscriptions” page, you can add a new subscription by clicking “+ New Subscription”. Then it would direct you to Product Selection Page that shows you what services can be offered. Choose “Bosch IoT Hub”.
- Then select “Free Plan” and name your Bosch IoT Hub instance. The name should be unique (e.g.,
kuksa-tut-jun) and click “Subscribe”. - After that, you would see your subscription details. Click “Subscribe” again to finish the subscription process.
- Now you would be in Service Subscriptions Page. It would take a minute or two for your instance to change its status from “Provisioning” to “Active”. Make sure the status is “Active” by refreshing the page.
- When the status is “Active”, click “Show Credentials” of the target instance. Then it would show the instance’s credentials information. This information is used to go to the device registry and register your device in the further steps. (You don’t need to save this information since you can always come back to see.) Let’s copy and save the values of “username” and “password” keys under “device_registry” somewhere.
- Now go to Bosch IoT Hub - Management API. The Management API is used to interact with the Bosch IoT Hub for management operations. This is where you can register a device on the Bosch IoT Hub instance you’ve just created and get the tenant configuration that you would ultimately use as input arguments when running
cloudfeeder.py(kuksa.val - cloudfeeder.py Setup) for a specific device (e.g., Raspberry-Pi of a connected vehicle).
8-1. Click “Authorize” and paste the “username” and “password” that you copied in 7, then click “Authorize”. If successfully authorized, click “Close” to close the authorization window.
8-2. Under the “devices” tab, you can find the “POST” bar. This is to register a new device. Click the tab and then “Try it out” to edit. Copy and paste the tenant-id of the Bosch IoT Hub instance to where it is intended to be placed.
8-3. Under “Request body”, there would be a JSON dictionary like the following:
{
    "device-id": "4711",
    "enabled": true
}
You can rename the string value of “device-id” according to your taste:
{
    "device-id": "kuksa-tut-jun:pc01",
    "enabled": true
}
8-4. Then click “Execute”. If the server responses with a code 201, it means the device is successfully registered. If you click “Execute” with the same JSON dictionary again, it would return a code 409. Which means you have tried to register the same device again so it wouldn’t register it due to the conflict with the existing one. However, if you change “device-id” to something new and click “Execute”, then it would return a code 201 because you have just registered a new device name.
- Just like this, you can register up to 25 devices with a free plan Bosch IoT Hub instance. This means that 25 vehicles or any other IoT devices can be connected to this one Bosch IoT Hub instance and each and every one of them interacts with the instance through a unique “device-id”.
- To list all the registered devices’ ids, you can click the “GET /registration/{tenant-id}” bar, type the instance’s tenant-id and click “Execute”. If successful, the server would return a code 200 with the device data that lists all the devices that are registered to the instance.
9. What we have done so far is, create a Bosch IoT Hub instance and register devices in it. However, we haven’t yet configured credentials for each device. Credential information helps you access to a specific device that is registered in the instance. The following steps illustrate how to add new credentials for a device.
9-1. Under the “credentials” tab, find and click the “POST” bar.
9-2. Click “Try it out” and paste the tenant-id of the Bosch IoT Hub instance to where it is intended to be placed.
9-3. In the JSON dictionary, change the value of “device-id” to the target device-id’s value.
9-4. Set values of “auth-id” and “password” according to your preference:
{
    "device-id": "kuksa-tut-jun:pc01",
    "type": "hashed-password",
    "auth-id": "pc01",
    "enabled": true,
    "secrets": [
        {
            "password": "kuksatutisfun01"
        }
    ]
}
If the server responses with a code 201, it means that new credentials have been added successfully.
- Here the values of “auth-id” and “password” are used to run
cloudfeeder.py. Therefore it is recommended to save them somewhere.
9-5. Now we have all information to run cloudfeeder.py:
- Host URL: “mqtt.bosch-iot-hub.com”
- Protocol Port Number: “8883”
- Credential Authorization Username (e.g., “{auth-id}@{tenant-id}”): “pc01@td23aec9b9335415594a30c7113f3a266”
- Credential Authorization Password: “kuksatutisfun01”
- Server Certificate File: “iothub.crt”
- Data Type: “telemetry”
With the information in 9-5 (should be different in your case), we can run
cloudfeeder.py(kuksa.val - cloudfeeder.py Setup). Navigate tokuksa.val/vss-testclient/and command:$ python3 cloudfeeder.py --host mqtt.bosch-iot-hub.com -p 8883 -u pc01@td23aec9b9335415594a30c7113f3a266 -P kuksatutisfun01 -c iothub.crt -t telemetry
kuksa.cloud - InfluxDB (Time Series Database)

Now that we have set up a Hono instance, cloudfeeder.py can send the telemetry data to Hono every one to two seconds. Hono may be able to collect all the data from its connected vehicles. However, Hono is not a database, meaning that it doesn’t store all the collected data in itself. This also means that we have to hire a time series database manager that can collect and store the data received by Hono in chronological order.
InfluxDB is another kuksa.cloud’s component, that is an open-source time series database. In KUKSA, InfluxDB is meant to be used as the back-end that stores the data incoming to Hono. With InfluxDB, we can make use of the collected data not only for visualization but also for a variety of external services such as a mailing service or an external diagnostic service. InfluxDB should be located in the northbound of Hono along with Hono-InfluxDB-Connector that should be placed in-between Hono and InfluxDB.
- To set up InfluxDB and Hono-InfluxDB-Connector, we can use a Linux machine (Linux Machine (Data Consumer)). Based on Hono, the Linux machine here can be considered as a data consumer while the in-vehicle Raspberry-Pi is considered as a data publisher.
- The following steps to setup InfluxDB is written based on this tutorial.
VirtualBox with Ubuntu 18.04 LTS is used here for setting up InfluxDB and Hono-InfluxDB-Connector. (VM Setup Tutorial can be found here.) (If your default OS is already Linux, this step can be skipped.)
Run your Virtual Machine (VM) and open a terminal.
Before InfluxDB installation, command the following:
$ sudo apt-get update

$ sudo apt-get upgrade

$ sudo apt install curl

$ curl -sL https://repos.influxdata.com/influxdb.key | sudo apt-key add -

$ source /etc/lsb-release

$ echo "deb https://repos.influxdata.com/${DISTRIB_ID,,} ${DISTRIB_CODENAME} stable" | sudo tee /etc/apt/sources.list.d/influxdb.list
Then install InfluxDB:
$ sudo apt-get update && sudo apt-get install influxdb
Start InfluxDB:
$ sudo service influxdb start
- If there is no output produced from this command, you have successfully set up InfluxDB on your VM. Please continue with 6 if you want to know how to interact with InfluxDB through a Command Line Interface (CLI). Otherwise, you can directly move onto Hono-InfluxDB-Connector (dias_kuksa - Hono-InfluxDB-Connector).
Connect to InfluxDB by commanding:
$ influx
- After this command, you would be inside the InfluxDB shell.
Create a database, “kuksademo”, by commanding inside the InfluxDB shell:
> CREATE DATABASE kuksademo
- This command produces no output, but when you list the database, you should see that it was created.
List the database by commadning inside the InfluxDB shell:
> SHOW DATABASES
Select the newly created database, “kuksademo”, by commanding inside the InfluxDB shell:
> USE kuksademo
- It should produce the following output on the terminal: “Using database kuksademo”
Insert some test data using the following command:
> INSERT cpu,host=serverA value=0.64
- More information about inserting data can be found here
The insert command does not produce any output, but you should see your data when you perform a query:
> SELECT * from cpu
Type “exit” to leave the InfluxDB shell and return to the Linux shell:
> exit
(Optional) If you want to write test data from the Linux shell, you can run the following one line script:
$ while true; do curl -i -XPOST 'http://localhost:8086/write?db=kuksademo' --data-binary "cpu,host=serverA value=`cat /proc/loadavg | cut -f1 -d ' '`"; sleep 1; done
- This command will write data to the
kuksademodatabase every 1 second.
You can verify if data is being sent to InfluxDB by using the influx shell and running a query:
> influx
> USE kuksademo
> SELECT * FROM cpu
dias_kuksa - Hono-InfluxDB-Connector

Now that Hono and InfluxDB are set up, we need a connector application to transmit the incoming data from Hono to InfluxDB. cloudfeeder.py produces and sends Hono the result telemetry messages in a form of JSON dictionary. Therefore the connector application should be able to read the JSON dictionary from Hono, map the dictionary to several individual metrics and send them to InfluxDB by using the curl command.
- Since the messaging endpoint of Hono (Bosch IoT Hub) follows the AMQP 1.0 protocol, the connector application should also be AMQP based.
- An AMQP Based connector application can be found in
dias_kuksa/utils/cloud/maven.consumer.honofrom thejunh-ki/dias_kuksarepository. The application is written based oniot-hub-examples/example-consumerfrom thebosch-io/iot-hub-examplerespoitory.
To set up the connector, you have to clone the
junh-ki/dias_kuksarepository on your machine first:$ git clone https://github.com/junh-ki/dias_kuksa.git
Navigate to
dias_kuksa/utils/cloud/maven.consumer.honoand checkREADME.md. As stated inREADME.md, there are three prerequisites to be installed before running this application.
2-1. Update the system:
$ sudo apt update
$ sudo apt upgrade
2-1. Install Java (OpenJDK 11.0.8):
$ sudo apt install openjdk-11-jre-headless openjdk-11-jdk-headless
$ export JAVA_HOME=/usr/lib/jvm/java-11-openjdk-amd64/
$ echo $JAVA_HOME
2-2. Install Maven (Apache Maven 3.6.0):
$ sudo apt install maven
$ mvn --version
2-3. Install mosquitto-clients:
$ sudo apt install mosquitto-clients
2-4. Install curl:
$ sudo apt install curl
Navigate to
dias_kuksa/utils/cloud/maven.consumer.hono/and command the following:$ mvn clean package -DskipTests
- This command compiles the
srcfolder with Maven and produces thetargetfolder that contains a .jar formatted binary file,maven.consumer.hono-0.0.1-SNAPSHOT.jar.
Now that you have the binary file, you can execute the connector application. In the same directory,
dias_kuksa/utils/cloud/maven.consumer.hono/, command the following:$ java -jar target/maven.consumer.hono-0.0.1-SNAPSHOT.jar --hono.client.tlsEnabled=true --hono.client.username={messaging-username} --hono.client.password={messaging-password} --tenant.id={tenant-id} --device.id={device-id} --export.ip={export-ip}
- (Bosch IoT Hub) The corresponding info (messaging-username, messaging-password, tenant-id, device-id) can be found in Service Subscriptions Page.
- If
InfluxDBis deployed manually,export-ipshall be set to:localhost:8086. - The startup can take up to 10 seconds. If you are still running
cloudfeeder.py, the connector application should print out telemetry messages on the console.
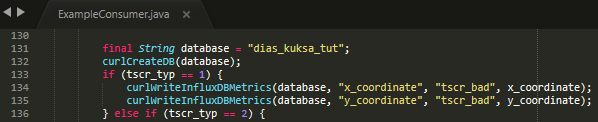
- (Optional) If you want to change the way the connector application post-processes telemetry messages, you can modify
ExampleConsumer.javathat can be found in the directory:dias_kuksa/utils/cloud/maven.consumer.hono/src/main/java/maven/consumer/hono/.
- The method,
handleMessage, is where you can post-process. - The
contentvariable is where the received JSON dictionary string is stored. - To seperate the dictionary into several metrics and store them in a map, the
mapJSONDictionarymethod is used. - Each metric is stored in a variable individually according to its type and sent to the InfluxDB server through the
curlWriteInfluxDBMetricsmethod. - You can add the post-processing part before
curlWriteInfluxDBMetricsif necessary.
kuksa.cloud - Grafana (Visualization Web App)

So far we have successfully managed to set up Hono and InfluxDB, and transmit data incoming to Hono to InfluxDB by running Hono-InfluxDB-Connector. Now our concern is how to visualize the data inside InfluxDB. One way to do this is to use Grafana.
Grafana is a multi-platform open source analytics and interactive visualization web application. The idea here is to get Grafana to read InfluxDB and visualize the read data.
- The installation steps to setup Grafana is written based on here.
To install Grafana (stable version 2.6) on your VM, run following commands:
$ sudo apt-get install -y apt-transport-https
$ sudo apt-get install -y software-properties-common wget
$ wget -q -O - https://packages.grafana.com/gpg.key | sudo apt-key add -
$ echo "deb https://packages.grafana.com/oss/deb stable main" | sudo tee -a /etc/apt/sources.list.d/grafana.list
$ sudo apt-get update
$ sudo apt-get install grafana
Start Grafana service:
$ sudo service grafana-server start
If this command doesn’t work, list PIDs on port 3000 (Grafana uses port 3000) to see whether grafana-server is already running on one of them:
$ sudo apt install net-tools
$ sudo netstat -anp tcp | grep 3000
assuming the PID number is: 13886:
$ sudo kill 13886
$ sudo service grafana-server start
Check whether the Grafana instance is running:
$ sudo service grafana-server status
ctrl+cto get out.
Now that the Grafana server is running on your machine, you can access to the server by using a web-browser. Open a browser and access to the following address:
http://localhost:3000/
Log in with the admin account:
Email or username: admin
Password: admin
After logging in, click “Configuration” on the left, click “Add data source” and select “InfluxDB”.
Then you would be in the InfluxDB Settings page. Go to “HTTP” and set URL as follow:
URL: http://localhost:8086
Then go to “IndluxDB Details”. Here we are going to select the “kuksademo” database that we have created to test InfluxDB. You can also choose another database that Hono-InfluxDB-Connector has been sending data to. To choose “kuksademo”, enter in the following information:
Database: kuksademo
User: admin
Password: admin
HTTP Method: GET
Click “Save & Test”. If you see the message, “Data source is working”, it means that Grafana has been successfully connected to InfluxDB.
Now you can create a new dashboard. Click “Create” on the left and click “Add new panel”.
Then you would be in the panel editting page. You can choose what metrics you want to analyze. This depends entirely on what metrics you have been sending IndluxDB. Since the metrics we have created in “kuksademo” is
cpu, you can set the following information:FROM:
defaultcpuClick “Apply” on the upper right. Now a new dashboard with a panel has been created, you can change the time scope, refresh or save the dashboard on the top.
- In the same way, you can create multiple panels in the dashboard for different metrics.
Deployment Option 2 - Docker Compose
Deployment Option 1 - Manual has been introduced to understand what kinds of cloud components are used for kuksa.cloud and how to configure them so that they can interact with each other. However, deploying each and every cloud component, configuring them, setting a data source for Grafana and designing a dashboard of it manually is not plausible when considering a huge number of connected vehicles. This is where container technology like Docker comes into play. A couple of key concepts are described below:
- Docker Container: A standard unit of software that packages up code and all its dependencies so the application runs quickly and reliably from one computing environment to another.
- Docker Compose: A tool for defining and running serveral Docker containers. A YAML file is used to configure the application’s services.
- Kubernetes: One difference between Docker Compose and Kubernetes is that Docker Compose runs on a single host, whereas Kubernetes is for running and connecting containers on multiple hosts.
The key point of using Docker is to facilitate automation so that users can deploy the applications in an agile and efficient way. To learn all the concepts and basics of Docker and be familiar with them, you can follow this tutorial. The subsequent contents are written based on the assumption that readers are familiar with Docker.
In the case of DIAS-KUKSA, there are two deployment options that utilize Docker:
- Docker Compose
- Azure Kubernetes Service(AKS)
When deploying with Docker Compose, it is assumed that a Bosch-IoT-Hub instance is already up and running. Therefore the deployment only includes: Hono-InfluxDB-Connector, InfluxDB and Grafana. Docker Compose runs only on a single host (a single Ubuntu machine). Even though it can only take care of a single connected vehicle, deploying with Docker Compose can be advantageous because it eases development process by reducing time and effort spent on setting deployment configuration for each application and creating the identical Grafana dashboard. Therefore Docker Compose deployment can be applicable for deveopment, test and evaluation purposes.
On the other hand, AKS includes all the cloud components (Eclipse Hono, Hono-InfluxDB-Connector, InfluxDB and Grafana) and runs on multiple hosts, meaning that it can be highly advantageous for commercial distribution that deals with a large amount of data transference involving with a number of connected vehicles. The downside of using AKS is that it costs money since the service is offered by Microsoft Azure and also the deployment configuration is more intricate. Therefore using AKS would be more favorable for commercial distribution rather than a development purpose.
In this part, Docker Compose deployment is closely covered. The contents include:
- How to install Docker and Docker Compose
- How to modify the
Hono-InfluxDB-ConnectorDocker image.- How to set data sources and dashboards on
Grafana’s according to your use-case.- How to setup
docker-compose.ymlfor the KUKSA cloud components (Hono-InfluxDB-Connector,InfluxDBandGrafana)- How to deploy the KUKSA cloud components with Docker Compose.
The end-goal here is to deploy these applications as Docker containers as the figure below and establish connectivity among these containerized applications.

Installing Docker and Docker Compose
Install Docker from the standard Ubuntu repository:
$ sudo snap install docker
- If you don’t install Docker with
snap, it is possible to face version conflict with Docker Compose. - Docker installation with
snapincludes Docker Compose installation.
Check the version:
$ docker --version
$ docker-compose --version
If you don’t want to preface the
dockercommand withsudo, create thedockergroup and add your user to thedockergroup:$ sudo groupadd docker $ sudo usermod -aG docker $USER $ newgrp docker
Log out and log back in to re-evaluate your group membership.
Run
dockercommands withoutsudoto verify that the changes have been applied:$ docker run hello-world
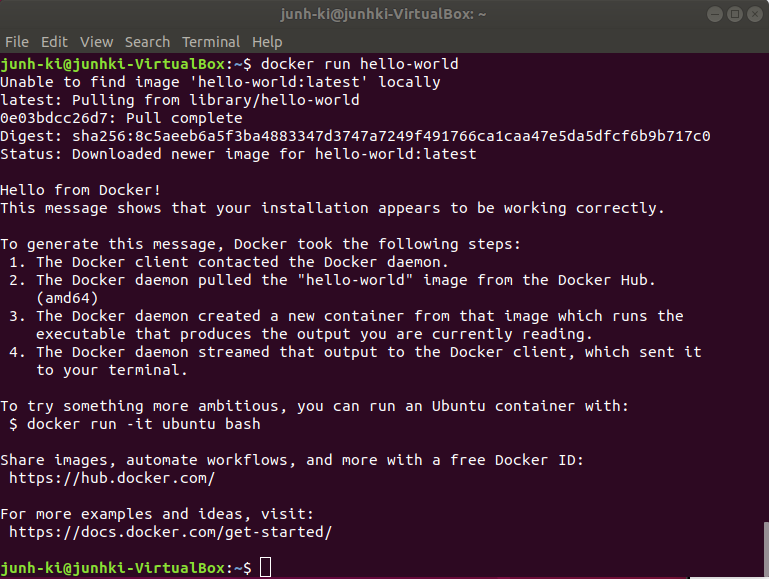
Now you are ready to proceed. If you only want to test the connectivity with the default DIAS-KUKSA setting, you can directly go to Deployment with Docker Compose.
Modifying and creating a Docker image for Hono-InfluxDB-Connector
Unlike InfluxDB and Grafana, Hono-InfluxDB-Connector is an application that is only designed to serve a particular task. This means that the application needs to be changed according to the target metrics. Since the application cannot be generic but only user-specific, it is important to understand how to make changes on the application, build a new Docker image with the new changes and push it to the Docker Hub registry. One might ask why the application needs to be docker-containerized and pushed to Docker Hub when one could simply run the result Jar file on a local machine. This can be easily explained with the figure below.

The figure describes the following scenario:
- Docker Host 1 builds the
Hono-InfluxDB-Connectorimage by running its Dockerfile. During the build process,MavenandJavaimages are pulled to build the executable Jar file.- After the Jar file is created, the Docker image is produced. Then Docker Host 1 pushes the Jar file to the Docker Hub registry in the Internet. (To do this, one needs to login to DockerHub on a local terminal to designate the destination repository.)
- Once the
Hono-InfluxDB-Connectorimage is available on Docker Hub, the other hosts (2, 3, 4) can also use the image as long as the Internet access is available and Docker (and Docker Compose) is (are) installed locally. Finally the other Docker hosts (2, 3, 4) pull and runHono-InfluxDB-Connectoralong withInfluxDBandGrafanathrough Docker Compose. The produced containers from Docker Compose are set to interact with each other according to the configuration setting indocker-compose.yml.
As already mentioned in 3), it doesn’t require for the rest of the Docker hosts (2, 3, 4) to pull and update the code according to the recent changes and build it with Maven to create the executable Jar file because the updated Hono-InfluxDB-Connector Docker image is already available on Docker Hub. All they need are Docker and Docker Hub installed locally with the Internet access and the pull-address of the updated image. This makes it possible to avoid repetitive tasks such as: pulling the source code repository, making changes and building the application with Maven to create the executable Jar file. In this way, a user can simply pull the application image from Docker Hub and run a container out of the image.
- Make changes in
dias_kuksa/utils/cloud/maven.consumer.hono/src/main/java/maven/consumer/hono/ExampleConsumer.javaaccording to your purpose.

- The changes should be made depending on the telemetry message sent by
cloudfeeder.py. Please consider the format of the message or the availability of intended metrics in the message.
To create a Docker image out of
Hono-InfluxDB-Connector, a Dockerfile is required. The Dockerfile forHono-InfluxDB-Connectoris located indias_kuksa/utils/cloud/maven.consumer.hono/. The Dockerfile consists of two different stages: Jar Building and Image Building. The Dockerfile can be self-explained with the comments in it. Navigate todias_kuksa/utils/cloud/maven.consumer.hono/and build the Docker image by commanding:$ docker build -t hono-influxdb-connector .
Assuming a Docker Hub account has already been made (Please make it in this link if you haven’t), log into Docker Hub on your terminal by commanding:
$ docker login --username={$USERNAME} --password={$PASSWORD}Before pushing
hono-influxdb-connectorto your Docker Hub repository, tag it according to the following convention:$ docker tag hono-influxdb-connector {$USERNAME}/hono-influxdb-connector
This way, the tagged Docker image would be directed to your respository on Docker Hub and archieved there when pushed.
Push the tagged Docker image:
$ docker push {$USERNAME}/hono-influxdb-connector(Optional) When you want to pull the image from Docker Hub on another Docker host, simply command:
$ docker pull {$USERNAME}/hono-influxdb-connector
Configuring a Grafana’s Data Source, Dashboard and Notifier

The above shows 7 dashboards that are created based on Bosch’s DIAS-KUKSA implementation. The following is one of the first 6 NOx-map dashboards.
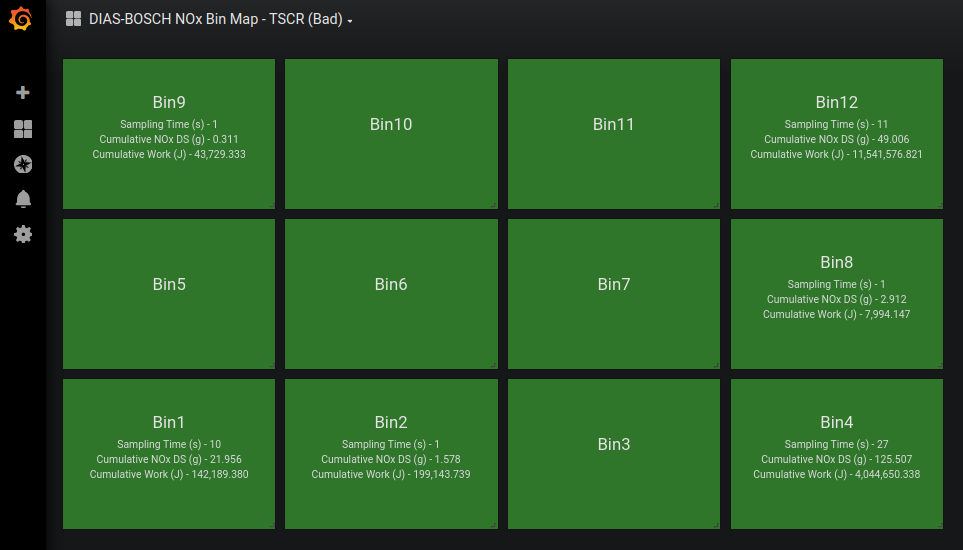
As named in the screenshot above, the depicted dashboard represents “DIAS-BOSCH NOx Bin Map - TSCR (Bad)” that consists of 12 status panels that each of which describes a data bin and has three metrics: Sampling Time (s), Cumulative NOx DS (g) and Cumulative Work (J). Each and every metric here comes from the InfluxDB data source. The rest of the first 6 dashboards follow the same format. The following is the last dashboard.

As shown above, the last dashboard is to keep track of the cumulative time of bin-data sampling. This dashboard is meant to send the administrator user an alert through a notifer feature if a certain sampling time threshold is met.
All these dashboards are simply designed to monitor a specific set of data stored in InfluxDB by Hono-InfluxDB-Connector conforming their intended purposes.
Since the Grafana Docker image is offered without any pre-configured dashboard and panel options, it could be easily presumed that users might have to set InfluxDB as a data source, create these dashboards with multiple panels and set a notifier via Email in Grafana manaually for several Docker hosts (Virtual Machines) everytime they deploy the application, which takes a lot of handwork and can be considered significantly inefficient.
Grafana’s provisioning system helps users with this problem. With the provisioning system, data sources, dashboards and notifiers can be defined via config files such as YML and JSON that can be version-controlled with Git.
- To set data sources when deploying
Grafanawith Docker Compose, a YML configuration file can be used. Underdias_kuksa/utils/cloud/connector-influxdb-grafana-deployment/grafana_config/grafana-provisioning/, there isdatasources/withdatasource.ymlinside.
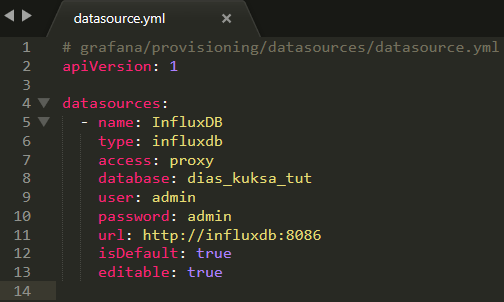
datasource.ymlcontains the same information used to set a data source manually on the Grafana web-page (Grafana Server > Configuration > Add data source: “InfluxDB”, “URL”, “Database”, “User”, “Password”).
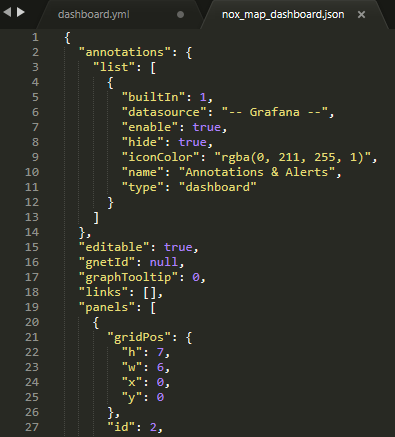
- Likewise, to set data sources when deploying
Grafanawith Docker Compose, a YML and a JSON configuration files can be used. Under the same/grafana-provisioning/directory, there isdashboards/withdashboard.ymlandnox_map_dashboard.jsoninside.

dashboard.ymlstates the name of the data source that dashboards receive data from and the path that the file would be located inside theGrafanacontainer when it runs.
- To create such dashboard JSON file, one needs to create a dashboard manually on Grafana, and export it as a JSON file (Grafana Server > Dashboards > Your_Target_Dashboard > Save dashboard (on the top) > “Save JSON to file”). Then rename it according to your preference. (e.g.,
nox_map_dashboard.json)
- As stated earlier, the last panel with the title of “Cumulative Bin Sampling Time” keeps track of the cumulative sampling time of data collection. If the point of evaluation is set to 10 hours, the threshold of the panel for notification would be 36000 considering sampling is done every second (10h = 600m = 36000s) approximately. When it finally reaches the threshold, Grafana would send a message to the registered email to notify the user that it is time to evaluate which can be done by setting
notifier.ymlin/grafana-provisioning/notifiers/.

notifier.ymlstates the type of notifier (e.g., Email, Slack, Line, etc…) and the receiver’s addresses in case when Email is chosen as the notifier type. If there are more than one receivers, multiple addresses can be added with semi colons that separate email addresses as shown in the screenshot. The result can be checked inAlerting > Notification Channelsin the Grafana web-server page.


- Now that you have set a notifier, you have to set an alert rule for you to receive a message from Grafana in a certain condition. The first screenshot above shows a condition that the alert is triggered when the query A,
total_sampling_time, is above 300. The second screenshot above shows the kind of message a receiver’s phone would receive viaGmailif the condition is met.
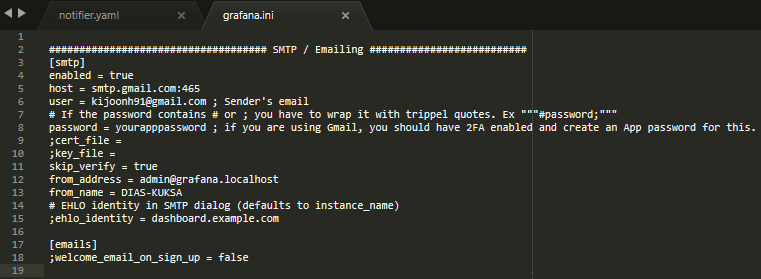
grafana.iniis located indias_kuksa/utils/cloud/connector-influxdb-grafana-deployment/grafana_config/and needs to be configured to enable SMTP (Simple Mail Transfer Protocol). Simply speaking, this is to set a sender’s Email account. In the case of Gmail, the address of SMTP host server issmtp.gmail.com:465(Click here to learn more about SMTP servers). Then set the sender’s Email address,user, and password,password. To use a Gmail account, one needs to have 2FA enabled for the account and then create an APP password forpassword(Click here to learn more about the APP password).from_addressandfrom_nameare set to change the sender’s information in the receiver’s perspective.- At the time of writing this documentation, only the graph panel visualization supports alerts as stated here.
It can be noticed that all configuration files for Grafana are located under /grafana_config/grafana-provisioning/ and /grafana_config/. These directories would later be used by Docker Compose to provision Grafana with data sources, dashboards and notifiers. Next, the explanation to the Docker Compose configuration file is followed.
Configuration Setup
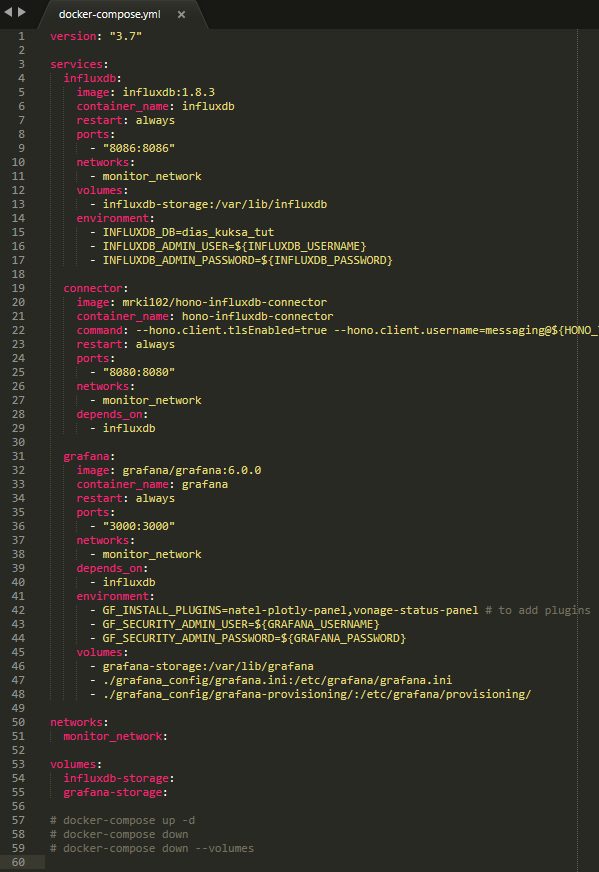
docker-compose.ymlruns three services (InfluxDB,Hono-InfluxDB-Connector,Grafana) here. Since all three services should be connected to each other, they need to be under the same network. Therefore a user-defined bridge network,monitor_network, needs to be configured under every service here:networks: - monitor_network networks: monitor_network:
Hono-InfluxDB-Connector`(`connector) andGrafana`(`grafana) have a dependency onInfluxDB`(`influxdb). Therefore a dependency needs to be configured underconnectorandgrafana:depends_on: - influxdb
Since the
connectorservice is just a data intermediary, it doesn’t need to be persistent. On the other hand,influxdbandgrafanashould be persistent if a user wants to save the accumulated data or metadata even when the services are taken down. Therefore a user-defined volume needs to be configured under each ofinfluxdbandgrafana:volumes: - influxdb-storage:/var/lib/influxdb volumes: - grafana-storage:/var/lib/grafana - ./grafana_config/grafana.ini:/etc/grafana/grafana.ini - ./grafana-provisioning/:/etc/grafana/provisioning/ volumes: influxdb-storage: grafana-storage:
Here, /grafana_config/grafana.ini:/etc/grafana/grafana.ini and /grafana-provisioning/:/etc/grafana/provisioning/ are additionally added for grafana. These are to provision grafana with the datasource, dashboard and notifier that have been configured in Configuring a Grafana’s Data Source, Dashboard and Notifier. Therefore docker-compose.yml finds grafana_config/grafana.ini and grafana-provisioning/ in the current directory and map them to /etc/grafana/grafana.ini and /etc/grafana/provisioning/ respectively that are in the grafana Docker service’s file system. Likewise, each of internally defined volumes (influxdb-storage and grafana-storage) are mapped to the corresponding directory in the target service’s file system.
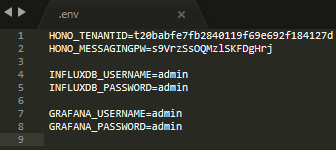
- The information of username and password to connect to each
influxdbandgrafanaserver, and that of the targetBosch-IoT-Hubinstance can be provided for theconnectorservice with theenvfile as they can be dynamic depending on the user.envis in the same directory wheredocker-compose.ymlis located and is hidden by default.
The information needs to be stated in docker-compose.yml as well:
environment:
  - INFLUXDB_DB=dias_kuksa_tut
  - INFLUXDB_ADMIN_USER=${INFLUXDB_USERNAME}
  - INFLUXDB_ADMIN_PASSWORD=${INFLUXDB_PASSWORD}

command: --hono.client.tlsEnabled=true --hono.client.username=messaging@${HONO_TENANTID} --hono.client.password=${HONO_MESSAGINGPW} --tenant.id=${HONO_TENANTID} --export.ip=influxdb:8086

environment:
  - GF_INSTALL_PLUGINS=natel-plotly-panel,vonage-status-panel # to add plugins
  - GF_SECURITY_ADMIN_USER=${GRAFANA_USERNAME}
  - GF_SECURITY_ADMIN_PASSWORD=${GRAFANA_PASSWORD}
INFLUXDB_DB=dias_kuksa_tut: The database is set asdias_kuksa_tutbecause it is the name of the database thatHono-InfluxDB-Connectoris targetting at.
export.ipfollows{$SERVICE_NAME_IN_DOCKER-COMPOSE-FILE}:{$PORT_NUMBER_IN_DOCKER-COMPOSE-FILE}. Therefore it isinfluxdb:8086.GF_INSTALL_PLUGINS=natel-plotly-panel,vonage-status-panel: The NOx Map dashboard that we are trying to provision uses thevonage-status-panelplugin that is not provided by default.natel-plotly-panelis just addtional to show how multiple panel-plugins can be added.
Deployment with Docker Compose
- Make sure a
Bosch-IoT-Hubinstance is up and running. If you haven’t brought it up, please do it now by following kuksa.cloud - Eclipse Hono (Cloud Entry). - Make sure you have Docker and Docker Compose installed in your machine. If you haven’t installed, please do it now by following Installing Docker and Docker Compose.
- In the dias_kuksa repository, you can find the
docker-compose.ymlfile in ‘dias_kuksa/utils/cloud/connector-influxdb-grafana-deployment/’. With one command you can deploy all the applications according to the pre-configured setting in the file. But there are few things that need to be done by each user.
3-1. In env, change HONO_TENANTID and HONO_MESSAGINGPW according to your Bosch-IoT-Hub instance’s credentials.
3-2. According to docker-compose.yml, influxDB, connector and grafana are deployed on port 8086, 8080 and 3000 respectively. Therefore the corresponding ports should be available before running Docker Compose. To see the availability of a certain port, one can use net-tools. With this, one can also kill any service that is running on a certain port to make it available for the target application. Install net-tools and list PIDs on port 8086 (InfluxDB - 8086, Connector - 8080, Grafana - 3000):
$ sudo apt install net-tools
$ sudo netstat -anp tcp | grep 8086
By now, a list of PIDs would be shown on the terminal.
3-3. Assuming the number of PID that is running on port 8086 is 13886, you can kill the PID with the following command:
$ sudo kill 13886
3-4. Stop InfluxDB and Grafana if they are already running locally without using Docker:
$ sudo service influxdb stop
$ sudo service grafana-server stop
- Because they are set to be running on port 8086, 8080 and 3000 respectively, it makes sense to stop them to secure the corresponding ports before running Docker Compose.
Now that you have made sure all three ports (8080, 8086 and 3000) are available, navigate to
dias_kuksa/utils/cloud/connector-influxdb-grafana-deployment/where thedocker-compose.ymlfile is located and command the following:$ docker-compose up -d
If there is no error output, you have successfully deployed all applications configured in the docker-compose.yml file.
Double-check whether three containers are created and working properly:
$ docker ps
Make sure Hono-InfluxDB-Connector, InfluxDB and Grafana are in the “Up” status.
- Now you should be able to access to the Grafana server through a web-browser.
6-1. Open a browser and access to http://0.0.0.0:3000/.
6-2. Log in with the admin account:
Email or username: admin
Password: admin
6-3. You can access and monitor the provisioned NOx map dashboard (Dashboards > NOx Map Dashboard). Change the time range according to your preference.
In case where the provisioned dashboard is not displayed on the main page, please hover over “Dashboards” on the left-side bar and then go to “Manage”. You would be able to see “NOx Map Dashboard” under the “General” folder.
<Additional Docker Compose commands>
- To stop your services once you have finished with them::
- $ docker-compose down
- To also remove the data volume used by the containers::
- $ docker-compose down –volumes
Deployment Option 3 - Azure Kubernetes Service (AKS)
** WORK IN PROGRESS… **
(Additional) dias_kuksa - InfluxDB-Consumer
Since there are possibly more applications that use InfluxDB other than Grafana, it makes sense to create a consumer application that fetches data from InfluxDB and makes them available for any purposes.
- There is an InfluxDB consumer Python script,
influxDB_consumer.py, indias_kuksa/utils/cloud/. - The script fetches the last data under certain keys from the local InfluxDB server and store them in the corresponding Python dictionary to each key by using the function,
storeNewMetricVal. Then you can use the data in the Python dictionary according to your purpose and goals.